A cloud-connected array of GNSS sensors that measures ionospheric electron content in real time using dual-frequency GPS signals, streaming live data to a web dashboard.
The ionosphere a layer of charged particles 80–1,000 km above Earth bends and delays GPS signals in ways that vary with solar activity, rocket launches, and geomagnetic storms. By measuring how dual-frequency GPS signals (L1 at 1575.42 MHz and L2 at 1227.60 MHz) are delayed differently, you can calculate the Total Electron Content (TEC) of the ionosphere along the signal path. WAMTEC deploys a distributed array of ground stations to monitor these variations in real time.
Each sensor package is built around a Teensy 4.1 microcontroller paired with a u-blox ZED-F9P dual-frequency GNSS receiver. The ZED-F9P outputs raw UBX measurement data including per-satellite pseudoranges (C1, C2) and carrier phases (L1, L2) at configurable intervals. The Teensy parses these measurements using the SparkFun u-blox GNSS v3 library and constructs JSON payloads containing per-satellite signal data, position, and system telemetry.
Since the Teensy's NativeEthernet library doesn't support TLS, a Cloudflare Worker serves as a permanent HTTP-to-HTTPS proxy accepting plain HTTP from the Teensy and forwarding requests as HTTPS to Firebase. This runs on Cloudflare's free tier with no ongoing cost.
The ionospheric delay on a GPS signal is frequency-dependent: lower frequencies are delayed more. The difference in pseudorange between L1 and L2 signals from the same satellite is directly proportional to the TEC along the signal path. The dashboard computes both code TEC from pseudorange differences (C1 − C2) and phase TEC from carrier phase measurements (L1, L2), displayed per-satellite with PRN identification.
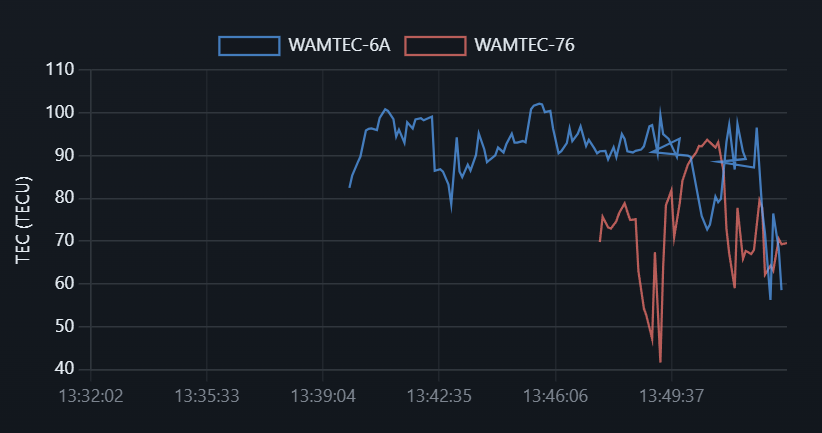
Typical values range from 5–50 TECU during quiet conditions, with spikes above 100 TECU during solar storms or other ionospheric disturbances. The system has successfully measured ~100–140 TECU during daytime observations, consistent with the current solar maximum of Solar Cycle 25.
The web dashboard is hosted on Firebase Hosting and reads from the Realtime Database via WebSocket using Firebase's onValue listener. It renders real-time charts for TEC (code and phase, per-satellite), GNSS position and altitude, battery voltage, internal temperature, and a Leaflet map showing unit locations. Each unit is automatically identified by its Teensy's hardware MAC address and assigned a unique color on all charts.
The architecture supports up to 20+ simultaneous units with no code changes. Each Teensy auto-generates a unique unit ID from its MAC address and writes to its own Firebase path. The dashboard dynamically discovers and renders all active units. Two units have been tested simultaneously, producing correlated TEC measurements that validate the array concept, identical ionospheric events are visible across both units with timing consistent with their shared sky view.
Cloud infrastructure: Firebase Realtime Database, Hosting, and security rules. Cloudflare Worker proxy for HTTPS translation. Python simulator generating realistic 20-unit sensor data for dashboard development. Teensy firmware integrating the SparkFun u-blox v3 library for RXM-RAWX parsing, ArduinoJson for payload construction, and NativeEthernet for HTTP transmission with SD card fallback. Web dashboard with Chart.js time-series visualization, Leaflet mapping, and live Firebase data binding.